
Tracert Explained
Following the Digital Breadcrumbs of the Internet

Imagine sending a physical package to a friend halfway across the world. You know when it arrives, but what if it gets stuck? Wouldn’t it be useful to see exactly which distribution center is holding it up?
In the world of networking, tracert (pronounced “trace route”) is the tool that gives you that visibility. It maps the journey your data takes across the internet, hop by hop, from your computer to a destination server.

What is Tracert?
tracert (short for Trace Route) is a command-line utility used to diagnose network path issues. It displays the route (path) and measures transit delays of packets across an Internet Protocol (IP) network.
While a ping command tells you if a destination is reachable, tracert tells you how it gets there and where it might be slowing down.
How It Works: The “Time to Live” Trick
The magic of tracert relies on a field in IP packet headers called TTL (Time to Live).
Contrary to its name, TTL isn’t about time; it is a counter. Every time a packet passes through a router (a “hop”), that router decreases the TTL value by 1. When the TTL hits 0, the router discards the packet and sends an error message (”ICMP Time Exceeded”) back to the sender.

Here is the step-by-step process:
Probe 1: Your computer sends a packet with TTL = 1.
The first router receives it, decreases TTL to 0, drops the packet, and replies “Time Exceeded.”
Result: Your computer now knows the IP address of the first hop.
Probe 2: Your computer sends a packet with TTL = 2.
The first router passes it (TTL becomes 1). The second router receives it, decreases TTL to 0, drops it, and replies.
Result: Your computer now knows the IP address of the second hop.
Repeat: This continues, increasing the TTL by 1 each time, until the packet finally reaches the destination or hits a maximum hop limit (usually 30).
How to Run a Trace
The command is simple and built into almost all operating systems.
On Windows:
Open Command Prompt (Start > type
cmd> Enter).Type the following and press Enter:
DOS
tracert google.comOn macOS / Linux:
The command is slightly different (and often uses UDP packets instead of ICMP, though the concept is the same).11
Open Terminal.
Type:
traceroute google.com
Deciphering the Results
When you run the command, you will see a list of lines generated in real-time. Here is how to read them:


A typical line looks like this:
3 12 ms 14 ms 11 ms ae-1-4.bar1.SanFrancisco1.Level3.net [4.69.140.1]
Here is the breakdown of those columns:
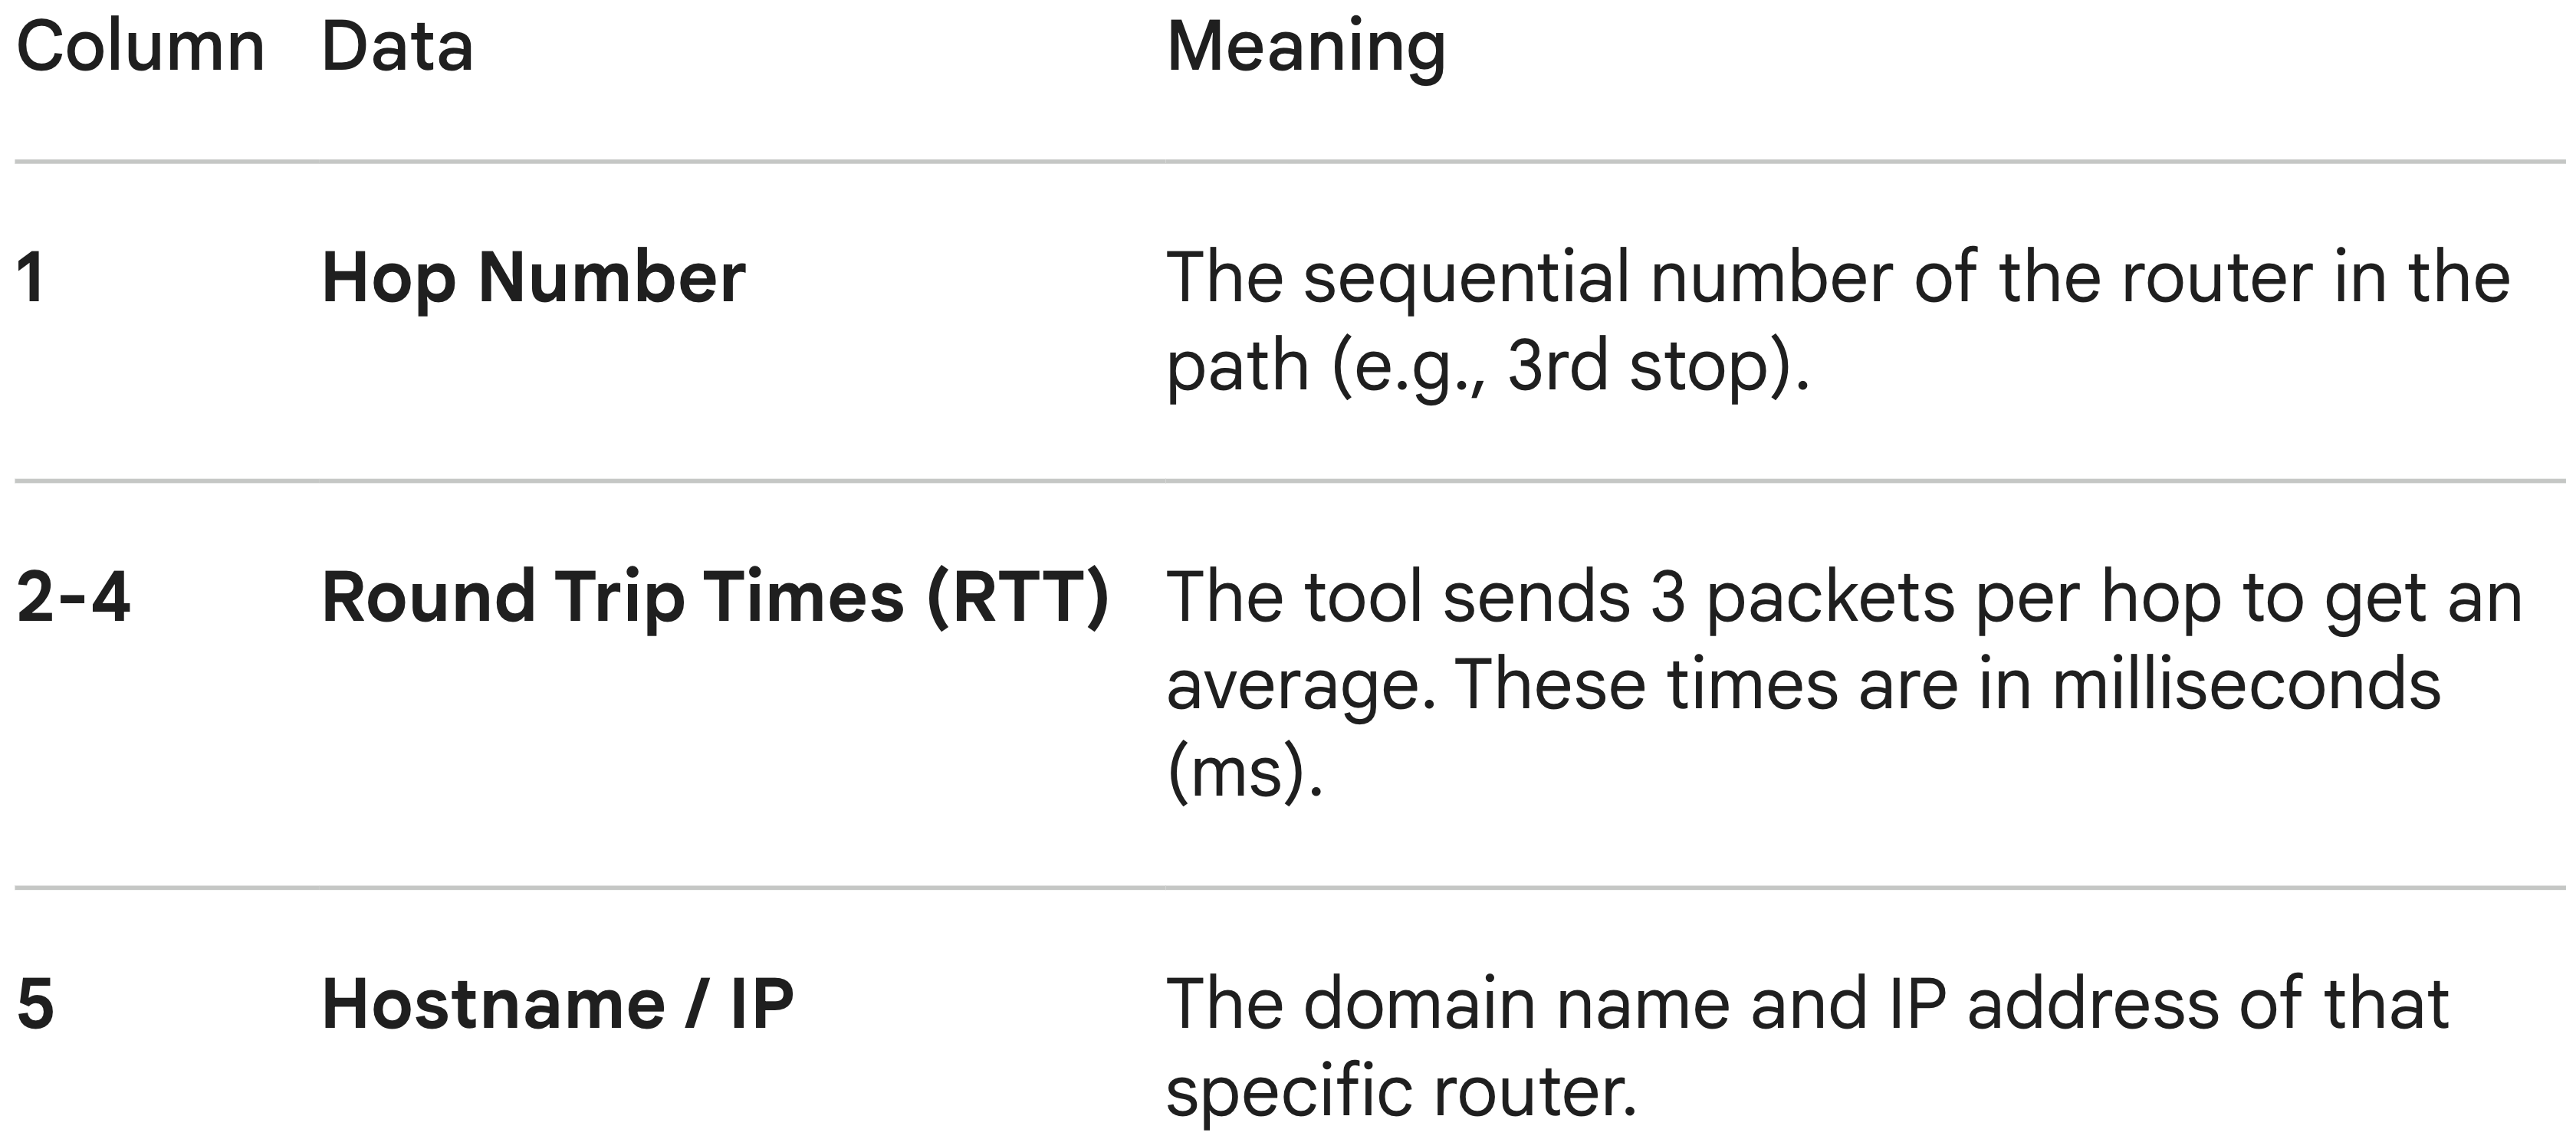
𝐋𝐞𝐚𝐫𝐧 𝐭𝐨 𝐛𝐮𝐢𝐥𝐝 𝐆𝐢𝐭, 𝐃𝐨𝐜𝐤𝐞𝐫, 𝐑𝐞𝐝𝐢𝐬, 𝐇𝐓𝐓𝐏 𝐬𝐞𝐫𝐯𝐞𝐫𝐬, 𝐚𝐧𝐝 𝐜𝐨𝐦𝐩𝐢𝐥𝐞𝐫𝐬, 𝐟𝐫𝐨𝐦 𝐬𝐜𝐫𝐚𝐭𝐜𝐡. Get 40% OFF CodeCrafters: https://app.codecrafters.io/join?via=the-coding-gopher
Interpreting the Diagnostics
You use tracert to find latency (slowness) or packet loss (connection breaks).
